

-
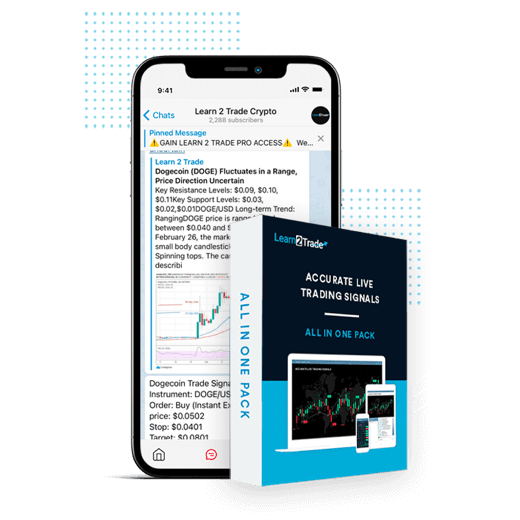
 Service for copy trading. Our Algo automatically opens and closes trades.
 -
Up to 70 trades per month. There are more than 5 pairs available.
-
The L2T Algo provides highly profitable signals with minimal risk.
-
Real-time alerts, all via Telegram
-
24/7 cryptocurrency trading. While you sleep, we trade.
-
Monthly subscriptions begin at £58
 Service for copy trading. Our Algo automatically opens and closes trades.
 Premium Plan
Unlock Daily Forex Signals
1 - month
Subscription
-
Up to 5 signals daily
-
76% success rate
-
Entry, take profit & stop loss
-
Amount to risk per trade
-
Risk reward ratio
month
3 - month
Subscription
-
Up to 5 signals daily
-
76% success rate
-
Entry, take profit & stop loss
-
Amount to risk per trade
-
Risk reward ratio
month
 Most popular
6 - month
Subscription
-
Up to 5 signals daily
-
76% success rate
-
Entry, take profit & stop loss
-
Amount to risk per trade
-
Risk reward ratio
 Up to 5 signals daily
month
Lifetime
Subscription
-
Up to 5 signals daily
-
76% success rate
-
Entry, take profit & stop loss
-
Amount to risk per trade
-
Risk reward ratio
Separate Swing Trading Group
-
Up to 5 signals daily
-
76% success rate
-
Entry, take profit & stop loss
-
Amount to risk per trade
-
Risk reward ratio
month
1 - month Subscription
-
Up to 5 signals daily
-
76% success rate
-
Entry, take profit & stop loss
-
Amount to risk per trade
-
Risk reward ratio
month
3 - month Subscription
-
Up to 5 signals daily
-
76% success rate
-
Entry, take profit & stop loss
-
Amount to risk per trade
-
Risk reward ratio
month
Most popular
6 - month
Subscription
-
Up to 5 signals daily
-
76% success rate
-
Entry, take profit & stop loss
-
Amount to risk per trade
-
Risk reward ratio
month
Lifetime
Subscription
-
Up to 5 signals daily
-
76% success rate
-
Entry, take profit & stop loss
-
Amount to risk per trade
-
Risk reward ratio
Separate Swing Trading Group
-
Up to 3 signals weekly
-
76% success rate
-
Entry, take profit & stop loss
-
Amount to risk per trade
-
Risk reward ratio
month
Become a Professional Forex Trader!
Get LIFETIME access to our VIP forex signals for FREE! Register and deposit the minimum 250 USD with our chosen regulated FX/CFD broker below and receive LIFETIME access to our VIP Forex Signals for FREE!
Choose the best broker in your country
8 cap. The most popular trading platform in the world, with thousands of CFDs. In one location: Indices, FX, Crypto, and more. We go above and above by offering a user-friendly UI and cutting-edge features.
Don’t invest unless you’re prepared to lose all the money you invest. This is a high-risk investment and you are unlikely to be protected if something goes wrong. Take 2 minutes to learn more
What’s Included in Our Award Winning Free Forex Signals Telegram Channel
If you are new to the forex market and you would like to get a taste of what our forex signals are like - join our free Forex Signals Telegram channel below!
Join our free telegram group
 Daily Technical Analysis & Weekly Webinars
 Unlock Entry Price
 Up to 5 VIP Forex Signals a day
 Mobile Notifications & Telegram Alerts On All Signals
 Alerts On Economic Events
Best Forex Signals Provider 2024
Meet Our Professional Traders
-
Experts in the main financial markets
-
Chat 24/7 with our pro traders
-
Live webinars
-
Free and VIP Signals
-
Best forex signals
-
Full technical analysis
-
Every question will be answered


Orlando Gutierrez
15+ years of tradingI believe fundamentals are key to long-term profitability. If you don't know what's moving the markets you are trading you will never be able to make money trading them. I have a very strong grasp on global macro. This means my overall bias, whether I want to buy or sell a currency is always determined by the reality of the economy. Understanding how monetary and fiscal policies affect the valuation or devaluation of a given currency is what I do. That's the edge.

Olimpiu Tuns
10+ years of tradingOlimpiu Tuns graduated with a Master in Business Administration. He is a seasoned Market Analyst / Trader / Trainer with 10 years of experience in the financial markets having expertise in Forex, Commodities, Index, Cryptocurrencies, and Stocks.His fascination with financial markets started back in 2010, and soon after he began to trade with his own capital. It didn’t take him long to become a senior market analyst, signal provider, portfolio manager, and trainer.He worked as a Market Analyst for three major brokerage companies, as a prop trader, and as a contributor/content creator for news portals, and educational platforms.

Azeez Mustapha
16+ years of tradingThe best method I use in engaging the markets is to go with the flow of the market. That is, to follow the line of the least resistance. I do not go against the flow of the current, as it is easier and more profitable to go with the flow. Whatever the effects of economic and fundamental events have on the markets, I will see them in the charts. Then I will use simple technical analysis to pinpoint the exact entry points. This also determines my exit points – something very crucial in trading.
What’s Included In Our VIP Forex Signals Telegram Channel
Join our existing 3500+ members from all over the world who have been profiting from our VIP forex signals and become professional traders.
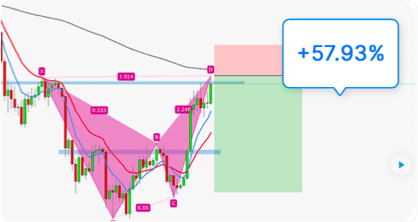
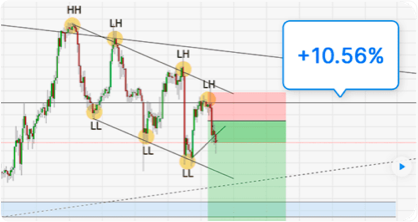
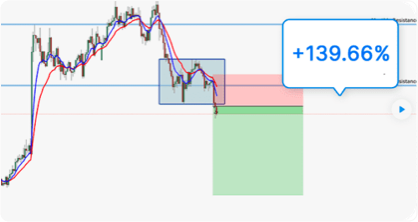
Here is more proof of our results
Read our trust pilot reviews on our Forex Signals to understand that you wnat to improve you trading skills

Only positive results trading with Learn 2 Trade
I've been trading with Learn 2 Trade for a few months, and my average success rate is around 70% with forex signals. And I've seen that over the course of two months, the total number of profitable trades exceeds the number of losing trades. The hitch with failing trades is that the losses are always capped by the precise stop-loss levels that were indicated. On every signal provided, the total risk to reward ratio appears to be very alluring. A thorough analysis of the signals is frequently offered in addition to just the indications with precise entry and departure positions, which greatly aids in learning and self-improvement.

Services provided are excellent
Overall, the services are first-rate. I am eager to collaborate with them in the future for forex signals. I'll trade not just forex but also cryptocurrencies, indices, etc. The services are fantastic, and I receive responses very soon after sending a message. The best thing is, however, that they are learning about signals and that great care is taken to get to know the consumer in order to comprehend the trading process as a whole. In addition to several signals, suppliers lack. But I believe that in the long run, this might serve as the primary meal for ongoing success.

I don’t usually write reviews but
Trading is now much more accessible, which has led to an increase in volatility as well as the peculiar economic period we are seeing as nations attempt to recover from COVID. People seem to have erroneous ideas about what forex signals and analytics will accomplish since they overlook this, and all of the scam guru 1000 pip a day tactics produce an odd story. Despite the fact that not every trade will succeed—which it won't because of the volatility—I utilize these forex signals and have for a time, and they have been profitable for me. Even if you learn to trade yourself, you won't obtain a 100% hit rate if you anticipate it. I personally utilize the forex signals as a guide, and I discover some trades to be quite beneficial along with insightful.

Legit content, good and timely signals
They do offer a fantastic service, and I've been dealing with them for a few months now. Although I work full-time, I trade as a hobby. You should cherish the forex signals as well as the knowledge they convey. Although I've had success with them, you should exercise self-control and only utilise the forex signals as a source of ideas or as a market scanning tool. Recently, they have been uploading quality content to YouTube. They now post a daily watchlist, which is excellent for giving me a feel of the chances for the day as I work.

I am a VIP signal user
I must express how grateful I am that L2T gives out full forex signals because I use the VIP signal. I looked at a few other signal services, and I found that the majority of them always masked off a portion of the signals. You will receive all the information, including the entry price, take profit, and stop loss, once you join up. I've been trading for a year, and the last six months have been spent utilising L2T. I've found that L2T has a decent win percentage. Additionally, it has helped me stop continually monitoring the markets myself.

L2T is the first forex signals...
The first forex signals service I registered with was Learn 2 Trade. Naturally, I began with the free Telegram signals to get a feel for what they have to offer. Surprisingly, almost 80% of the alerts they sent caused me to make money. I was also persuaded to purchase the premium subscription. The fact that they inform you of new forex signals is the nicest part. For instance, if the market circumstances have altered, you can get another warning to modify your stop-loss. Additionally, they usually send you an analysis of the data on which they base their trade tips. This is great since you can independently validate the signals if necessary.

Amazing signal service I already tried
Incredible signal service. This signal service is very honest with their users, which is really important in addition to the quality of the signals because it demonstrates that the team is showing their users respect by first providing high-quality signals and then by being transparent with their clients. I have tried many forex signals services before, and I found that 95% of those groups were not transparent. In addition to the signals being fairly accurate, the traders constantly monitor specific transactions and alert us to any necessary adjustments to SL, TP levels, etc. I really enjoy the professional webinars that analyse and explain upcoming trading chances. I heartily endorse this
What’s Included in Our Free Forex Signals Telegram Group
Join our 40000+ members in the FREE forex signals Telegram group, no details required just click the button and join without paying anything!
Our Traders Have Been Scouted From Trading Floors Based All Over the World!
FAQ About Forex Signals
What are Forex Signals?
How Does the Learn 2 Trade Forex Signals Service Work?
Is The Forex Signals Service Really Free?

What are Forex Signals Based on?
What to Consider When Choosing a Forex Signals Provider?
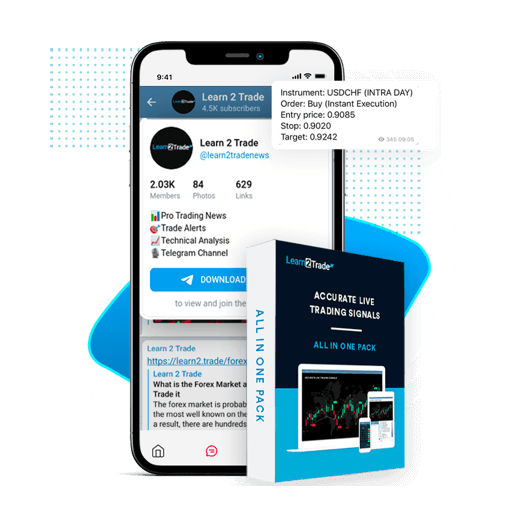
Never Miss a Beat on Trade
All of our forex signals are sent live through Telegram, it can be downloaded on any smartphone and desktop, just turn on your Telegram notifications and get our signals live!
-
Signals are sent live via Telegram
-
All market news
-
Telegram works on all smartphones and desktop
-
Takes less than a minute to set up
-
Join our free Telegram group to test it out